
Here is my first visualization using plot.ly. I had also wanted to add a pie chart below each user’s name to show what percentage of their total followers came from Facebook and Twitter, but I’m not sure if plot.ly allows that. Importing the data was mostly easy, except I had issues with headers in xlsx files not being imported as headers. I solved this by just using a csv version of my the data.
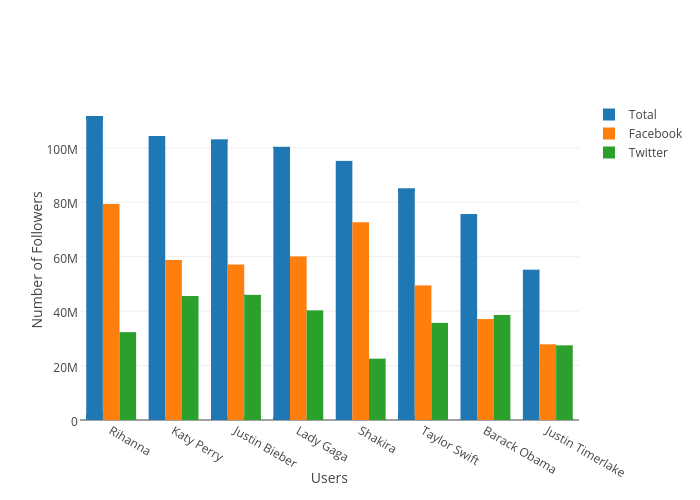
I created the the Total variable as an aggregate of the Facebook and Twitter values in order to help give re-express the comparison between each user. The data is sorted by the highest number of Total followers, which makes it easier to read. The Y axis is scaled linearly so that the differences are clear and unambiguous. Each value is color coded which highlights each grouping and makes it easier to follow values across users. Additionally, each axis is labeled/annotated and the legend reflects the color codes of each value.