Bug Squashing
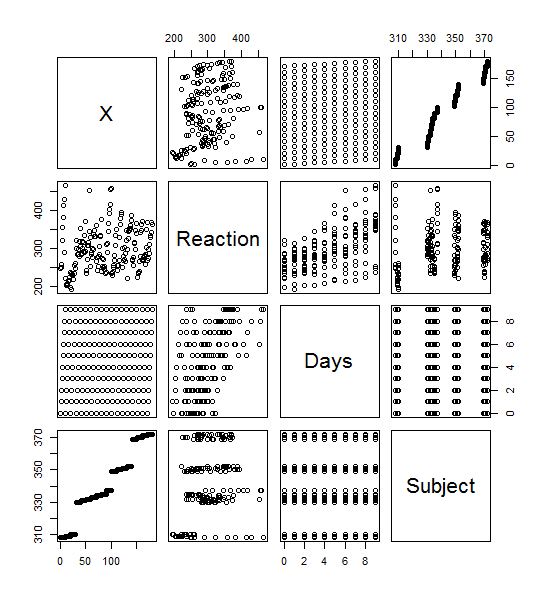
For this exercise, I again used the sleep study data from https://vincentarelbundock.github.io/Rdatasets/csv/lme4/sleepstudy.csv. I assigned the values for the numbers of days and the reaction times to the x and y values to matrix ‘x’. Next, I created the function for tukey.multiple().
> tukey_multiple <- function(x) {
+ outliers <- array(TRUE,dim=dim(x))
+ for (j in 1:ncol(x))
+ {
+ outliers[,j] <- outliers[,j] && tukey.outlier(x[,j])
+ }
+ outlier.vec <- vector(length=nrow(x))
+ for (i in 1:nrow(x))
+ {
+ outlier.vec[i] <- all(outliers[i,])
+ }
+ return(outlier.vec)
+ }
To start debug mode, you must first initialize it with > debug(tukey_multiple) and then try executing the function itself with > tukey_multiple(x). The debug mode spits out an error saying that it can’t find the function tukey.outlier, which is called for in line 5. In order to find the outliers we must first be able to identify why is and is not an outlier. In order to do so, we have to make a function to define the quartiles in the set of data:
> quartiles = function(data)
+ {
+ quarts = quantile(data, probs=c(.25,.75))
+ IQR = quarts[2] - quarts[1]
+ return(c(quarts,IQR))
+ }
Now that we have the quartiles, we can make a function to pull out the outliers:
>tukey.outlier = function(q)
+ {
+ if(!is.nutll(dim(q))){
+ return(tukey_multiple(q))
+ } else {
+ quarts = quartiles(q)
+ lowerbound = quarts[1] - 1.5*quarts[3]
+ upperbound = quarts[2] + 1.5*quarts[3]
+ outliers = c(rep(FALSE, length(q)))
+ outliers <- ((q < lowerbound) | (q > upperbound))
+ return(outliers)}
+ }
Moving forward from here, we can try to run >tukey_multiple(x) again. Doing so gives me an error “Error in tukey.outlier(x[, j]) : could not find function “is.nutll””. This one is due to a simple typo of is.null. This is fixed and the debug for tukey_multiple is ran again. The debug makes it past the previous errors and I proceeded through hitting enter through all 180 values of my data, ending in this:
exiting from: tukey_multiple(x)
 [1] FALSE FALSE FALSE FALSE FALSE FALSE FALSE FALSE FALSE FALSE FALSE FALSE FALSE FALSE FALSE FALSE FALSE FALSE FALSE FALSE FALSE FALSE
 [23] FALSE FALSE FALSE FALSE FALSE FALSE FALSE FALSE FALSE FALSE FALSE FALSE FALSE FALSE FALSE FALSE FALSE FALSE FALSE FALSE FALSE FALSE
 [45] FALSE FALSE FALSE FALSE FALSE FALSE FALSE FALSE FALSE FALSE FALSE FALSE FALSE FALSE FALSE FALSE FALSE FALSE FALSE FALSE FALSE FALSE
 [67] FALSE FALSE FALSE FALSE FALSE FALSE FALSE FALSE FALSE FALSE FALSE FALSE FALSE FALSE FALSE FALSE FALSE FALSE FALSE FALSE FALSE FALSE
 [89] FALSE FALSE FALSE FALSE FALSE FALSE FALSE FALSE FALSE FALSE FALSE FALSE FALSE FALSE FALSE FALSE FALSE FALSE FALSE FALSE FALSE FALSE
[111] FALSE FALSE FALSE FALSE FALSE FALSE FALSE FALSE FALSE FALSE FALSE FALSE FALSE FALSE FALSE FALSE FALSE FALSE FALSE FALSE FALSE FALSE
[133] FALSE FALSE FALSE FALSE FALSE FALSE FALSE FALSE FALSE FALSE FALSE FALSE FALSE FALSE FALSE FALSE FALSE FALSE FALSE FALSE FALSE FALSE
[155] FALSE FALSE FALSE FALSE FALSE FALSE FALSE FALSE FALSE FALSE FALSE FALSE FALSE FALSE FALSE FALSE FALSE FALSE FALSE FALSE FALSE FALSE
[177] FALSE FALSE FALSE FALSE
The current function looks for outliers in both dimensions and will display TRUE if there are outliers in both dimensions. What we want is for a readout if there’s an outlier in either dimension. Here, we redefine tukey_multiple() to only output a TRUE for having an outleir in either dimension:
> tukey_multiple = function(x) {
+ outliers <-array(TRUE, dim=dim(x))
+ outliers = apply(x,2,tukey.outlier)
+ outliers.vec = apply(outliers,1,any)
+ return(outliers.vec)
+ }
This debugs smoothly and outputs:
exiting from: tukey_multiple(x)
 [1] FALSE FALSE FALSE FALSE FALSE FALSE FALSE FALSE FALSE TRUE FALSE FALSE FALSE FALSE FALSE FALSE FALSE FALSE FALSE FALSE FALSE FALSE
 [23] FALSE FALSE FALSE FALSE FALSE FALSE FALSE FALSE FALSE FALSE FALSE FALSE FALSE FALSE FALSE FALSE FALSE FALSE FALSE FALSE FALSE FALSE
 [45] FALSE FALSE FALSE FALSE FALSE FALSE FALSE FALSE FALSE FALSE FALSE FALSE FALSE FALSE FALSE FALSE FALSE FALSE FALSE FALSE FALSE FALSE
 [67] FALSE FALSE FALSE FALSE FALSE FALSE FALSE FALSE FALSE FALSE FALSE FALSE FALSE FALSE FALSE FALSE FALSE FALSE FALSE FALSE FALSE FALSE
 [89] FALSE FALSE FALSE FALSE FALSE FALSE FALSE FALSE FALSE FALSE FALSE TRUE FALSE FALSE FALSE FALSE FALSE FALSE FALSE FALSE FALSE FALSE
[111] FALSE FALSE FALSE FALSE FALSE FALSE FALSE FALSE FALSE FALSE FALSE FALSE FALSE FALSE FALSE FALSE FALSE FALSE FALSE FALSE FALSE FALSE
[133] FALSE FALSE FALSE FALSE FALSE FALSE FALSE FALSE FALSE FALSE FALSE FALSE FALSE FALSE FALSE FALSE FALSE FALSE FALSE FALSE FALSE FALSE
[155] FALSE FALSE FALSE FALSE FALSE FALSE FALSE FALSE FALSE FALSE FALSE FALSE FALSE FALSE FALSE FALSE FALSE FALSE FALSE FALSE FALSE FALSE
[177] FALSE FALSE FALSE FALSE
It’s a mess since the data I used is so large, but there looks like there’s a couple outleirs in there at values 10 and 100. All is good and we can end debug mode with undebug(tukey_multiple).

